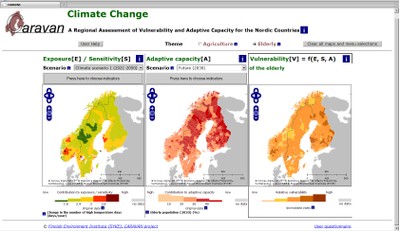
You are here: Home / Case studies / NE1 - Vulnerability of the elderly
case: NE1 location: Nordic region sectors: Health

Question

Which question has been addressed in this step?

Exploring risks: In which regions are elderly likely to be vulnerable to the future impacts of climate change?

Case step navigator: click any node to select the respective step

Why has this question been chosen?

  • Nordic countries have generally low vulnerability to climate change. But, there is a high degree of variability within the region. Most of population live in few urban centres, with very sparsely populated rural areas.
  • Future climate changes and impacts may pose risks to the elderly as elderly are known to be disproportionately negatively affected by heat-waves. Further, the development of the agestructure has been, and will continue to be very different in different parts of the region.

Which methods have been applied?

  • Socio-economic statistical data collection related to indicators of adaptive capacity of the elderly in Finland, Norway and Sweden. Indicators and combinations of indicators are mapped. Combinations represent composite indices of adaptive capacity of the elderly in the region.
  • Indicators of exposure and sensitivity future climate changes and impacts are computed from model-based climate projections for the region and averaged by municipality. The indicators can be mapped individually or combined into composite indices of exposure and sensitivity.
  • Development of an index of potential impact - a heatwave mortality index - for heatwaves. Combine projected temperatures and statistical models relating temperature to excess mortality in the region, based on existing literature.


Figure 1 - An example of the prototype CARAVAN web tool, depicting exposure/sensitivity of the elderly to climate change (left panel), adaptive capacity (central panel) and a combined vulnerability index (right panel).

Why have these methods been selected?

  • An indicator approach, can help to identify problem areas and guide discussions with stakeholders, when impact models are not available.
  • An interactive approach, which allows users or stakeholders the flexibility to map and combine indicators of their choice may make greater use of stakeholder knowledge when data on impacts is not available.

What results have been obtained?

  • Indicators of exposure/sensitivity and adaptive capacity will be represented spatially in an interactive web-based mapping tool and combined to visualise climate vulnerability according to user preferences.
  • It is evident that the spatial variability both of adaptive capacity and subsequently vulnerability within the region is large.

Reflections on this step

  • Moreover, we have also realised that vulnerability indices can be very sensitive to scenarios of the socioeconomic factors describing adaptive capacity. Projections of these factors are not commonly attempted, but might be of value for policy makers.

Pathfinder

MEDIATION Toolbox

Toolbox detail page(s) available for methods and tools applied in this case step:

CARAVAN

Details on this case study step


A tool has been developed for mapping the spatial distribution (by municipality) of factors (indicators) known to contribute to acute ill health or mortality in the elderly in the Nordic region. The tool is designed to provide basic knowledge to inform care providers and other specialists concerned with the welfare of the elderly about the distribution of potential risk factors associated with a changing climate as well as options for combining these according to user preferences into composite indices of vulnerability to climate change.