You are here: Home / Toolbox / Details
In the context of impacts, attribution refers to a confirmation that an observed trend in impacts can be related directly to a trend in climate. We use that definition below, but readers should be aware that this is only one of a number of alternative definitions used by the research community investigating climate change and its impacts (Box 3 3). In Box 3 3 this form of attribution is referred to as Method IV.

Box 3-3: Approaches to attribution of change (based on Hegerl et al. 2010)

An IPCC Expert Meeting convened in 2009 to clear up misunderstandings among different research communities, produced a good practice guidance document (Hegerl et al., 2010) that distinguishes between four methods of attribution commonly referred to in the literature. The first three methods focus on attribution of impacts or climate change to external forcing, including greenhouse gas increases. while the fourth addresses the link between impacts and climate as the main driver.

  • Method I. Single-Step Attribution to External Forcings comprises involves detecting a significant change in a variable of interest (e.g. a climate variable or an impact) and then comparing the observed changes with those expected, usually based on modelling the response of the variable to external forcings and drivers. Attribution is demonstrated if a statistically significant match is found and other confounding factors can be ruled out. An example is the direct statistical association established between advancement of phenology in the northern hemisphere and modelled anthropogenic climate change (misleadingly referred to as joint attribution) by Root et al. (2007),
  • Method II. Multi-Step Attribution to External Forcings, relates to assessments that attribute an observed change in a variable of interest to a change in climate and/or environmental conditions, plus separate assessments that attribute the change in climate and/or environmental conditions to external drivers and external forcings. An example would be the multi-step attribution of advancement in spring phenology, where in a first step advancement is related to observations of increasing regional temperature (see example in Figure 3-2), and in a subsequent step those observed temperature changes are related to external forcing and drivers (e.g. by comparison with modelled temperature changes). This is different from the Root et al. example of Method I, which made no reference to observed temperature change, thus leapfrogging the first step. Each step in multi-step attribution has its own level of confidence, and confidence in the combined result is similar to or weaker than the weakest step.
  • Method III. Associative Pattern Attribution to External Forcing is similar to Method II, but rather than analysing a single variable of interest, this method involves the synthesis of large numbers of results (often across multiple systems) and the demonstration of an association between impacts in these and climate change, followed by the attribution of this climate change to external forcing and drivers (often using spatial and temporal measures of association). For instance, Rosenzweig et al. (2008) demonstrated that changes in natural physical and biological systems since at least 1970 have occurred in regions of observed temperature increases, and that this warming at continental scales cannot be explained by natural climate variations alone. 
  • Method IV. Attribution to a Change in Climatic Conditions (Climate Change) involves assessments that demonstrate an association (based on process knowledge) between an observed change in a variable of interest and an observed change in climate conditions. This method can be one of the steps in Multi-Step Attribution, but it can also be used stand-alone to address climate impacts on a variable of interest.

Box 3-4: Overview of Impact Attribution

Theoretical assumption

Climate and/or non-climate drivers are responsible for observed impacts.

Question addressed

Which combination of variables can explain observed impacts on the study
unit?

Data requirements
  • Data on observed impacts
  • Data on potential explanatory variables

Typical result
Statistical model explaining observed impacts.

Generic steps
1. Select potential explanatory variables based on theory and literature
2. Apply statistical methods


In studies of impact attribution (Box 3-4), relationships between pairs of variables (i.e. univariate analysis) or sets of variables (i.e. multivariate analysis) are commonly explored through inferential statistical methods like regression analysis, correlation and analysis of variance. Both external factors like climate, land-use change and air pollution, as well as factors internal to a study unit (i.e. adaptive capacity; cf. Tol and Yohe, 2007) can account for observed impacts so explanatory variables should be carefully selected based on theory and literature. A general issue for attribution studies is the sheer number of possible explanatory variables, which is not conducive to building statistical models. Other challenges confronting analysts may include:
  • Discontinuous time series: abrupt changes or breaks in the time series must be identified and treated prior to analysis.
  • Scale issues: data for the explanatory variables must be matched to data on observed impacts.
  • Sample biases: systematic errors can prejudice evaluations and findings, especially biases in the sampling of observed impacts (i.e. over-reporting of climate-sensitive biological species versus less sensitive species) or publication bias towards results showing positive associations with climate and away from results exhibiting no longterm change.
  • Non-climate drivers: Climate is not the only variable that gives rise to impacts, and care must be taken not to conflate correlation with causation.
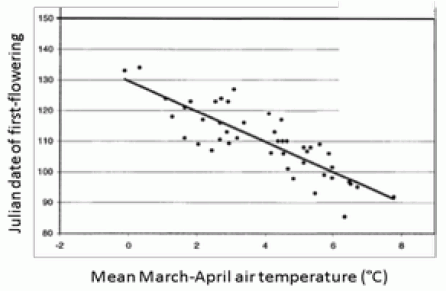
The example in Figure 3-1 demonstrated a trend in flowering dates of Aspen during the 20th century. The authors then went on to explore possible causes or attribution of this trend, concluding that March-April mean temperature in the Edmonton region exhibits a strong correlation with flowering dates (Figure 3-2). Moreover, they also go on to establish relationships with ocean temperatures in the Pacific, including the influence of the El Niño Southern Oscillation phenomenon (Beaubien and Freeland, 2000).

Fig. 3.2
Figure 3-2: Relationship between mean March-April temperature and flowering dates of Aspen (Populus tremuloides) during 1936-1998 in the area of Edmonton, Alberta. Each point represents a single year. Source: Beaubien and Freeland (2000).


Table 3-1 identifies examples of impact attribution studies across different sectors. Shumway and Stoffer (2011) provide additional guidance on techniques for the detection and attribution of observed impacts. They have written a textbook on time series analysis accessible to non-statisticians, which includes software examples for the R computing environment.

Table 3-1: Impact attribution studies by sector.

Sector Examples
Agriculture Crop responses (Lobell, 2010)
Livestock productivity and welfare (Gould et al., 2006; Mellor and Wittmann,
2002)
Water
Resource
Groundwater resources (Gemitzi and Stefanopoulos, 2011)
Drinking water resources (Kistemann et al., 2002)
Health Mortality associated with extreme weather (Conti et al., 2005; Hajat et al., 2002;
Keatinge et al., 2000; Barnett et al., 2005; Zanobetti and Schwartz, 2008)
Weather events and disease outbreaks (Wu et al., 2007; Reyburn et al., 2011;
Checkley et al., 2000; Singh et al., 2001; Hurtado-Diaz et al., 2007; Keay and
Simmonds, 2006)
Temporal patterns in the start dates of pollen seasons (Emberlin et al., 2002; van
Vliet et al., 2002)
Coastal/Marine Fisheries catch rates (Menard et al., 2007; Corbineau et al., 2008)
Marine pelagic phenology (Edwards and Richardson, 2004)
Species responses (Beaugrand et al., 2002; Beaugrand and Reid, 2003; Brander,
2005; Dutil and Brander, 2003)
Biodiversity Vegetation dynamics (Herrmann et al., 2005)
Phenological events (Schleip et al., 2006)
Animal responses (Sandvik and Erikstad, 2008; Chan et al., 2005)
Other Insurance and reinsurance markets (Romilly, 2007; Klawa and Ulbrich, 2003)

Pathfinder

Related decision tree of the Pathfinder:

Decision tree: Impact analysis