The application we present here allows the user to compare climate
scenario data developed at PIK for the German part of the Elbe basin
for the years 2001 to 2055 with observational data [1] recorded
nationwide for the period 1951 to 1998/2000.
Scenario models
represent one possibility of estimating future climate trends. They are
not forecasts, but rather "if - then"-type assessments. If the
concentration of carbon dioxide in the atmosphere increases, then the
atmosphere's temperature changes. The IPCC Third Assessment Report [2]
presents various scenarios with different levels of increase of global
carbon dioxide concentration. In order to extract from the resulting
global climate changes conclusions about regional climate changes,
appropriate regional climate models are used.
The scenario data
discussed here for the German part of the Elbe river basin are based on
Scenario A1B of the IPCC, which represents a moderate,
business-as-usual development path. For the Elbe basin it corresponds
to a mean increase in air temperature of around 1.4°C between the years
2001 and 2055. A statistical regional climate scenario model [3] was
used to calculate the most likely scenario for precipitation changes.
This indicates, e.g., for the federal state of Brandenburg, a mean
decrease in precipitation of about 80 mm per year [4] . This scenario,
however, represents only one of several possibilities for future
temperature and precipitation changes.
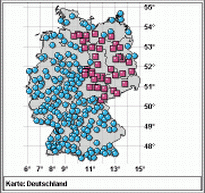
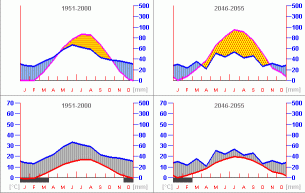
| Observation and scenario data are presented by means of dynamically generated climate diagrams using the methods of Walter [5] and Thornthwaite [6] . A hierarchic digital atlas permits the stations to be shown in their spatial context (Fig. 1). A simple click on any station with the left-hand mouse button opens a visualisation of the relevant station data (Fig. 2). | ||
 Fig. 1 |  Fig. 2 | |
Further developments planned for the future are
- to shift the transition between the reference and the scenario data from the year 2001 to 2004,
- to extend the scenario data base to cover the whole of Germany,
- to apply the technique of dynamic generation of climate diagrams to gridded data structures of global relevance.
| Click the button to the right of this text to open the diagram generator [7]. If this button is not visible, you first need to activate your browser's Java Virtual Machine. |
|
[1] The original data were kindly made available by the German Weather Service DWD.
[2] IPCC (2001), Climate Change 2001: Synthesis Report, Summary for Policymakers. Cambridge University Press, Cambridge UK
[3]
Werner, P.C., Gerstengarbe, F.-W. (1997), A proposal for the
development of climate impact scenarios. Climate Research, 8, 3, 171-182
[4] Gerstengarbe, F.-W. et al. (2003), Studie zur klimatischen Entwicklung
im Land Brandenburg bis 2055 und deren Auswirkungen auf den
Wasserhaushalt, die Forst- und Landwirtschaft sowie die Ableitung
erster Perspektiven. PIK-Report No. 83, Potsdam
[5] Walter, H., Lieth, H. (1964), Klimadiagramm-Weltatlas. Verlag Gustav Fischer, Jena
[6] Borchert, G. (1993), Klimageographie in Stichworten. Ferdinand Hirt, Berlin
[7] The application was developed at PIK by the working group on Scientific Data Management.
Optimized for Netscape/Mozilla 1.7 (Win), Firefox 1.0 (Win), Internet Explorer 5 (Win), Konqueror (Linux/KDE), Safari (Mac).
The browser needs to provide an enabled Java Virtual Machine (JVM 1.1 or higher).


