AP2
ToDo
Datenanfrage an JMD
- vorerst 2 synoptische Stationen: historisch und aktuell
- Radardaten für Starkregenereignis Nov. 2018
- direkte Einbindung in Demonstrator
- danach umfangreichere Datenanfrage an JMD
Logik für Demonstrator
- historisch, aktuell, zukünftig
- tabellarisch, grafisch (Karten, Diagramme)
- lokal, regional, global
- Ebenen der Komplexität: Experten, Nichtexperten
- Überlagerung von Kartenlayern
- Integration von externer Software zur Diagnostik
- Farbskalen, Legenden, Infografiken
- Speicherkapazität und Datenaggregation
- Infoboxen zu externen Material
- Factsheets
Diagnostik
- objektive Klassifikation von Strömungsmustern über dem Nahen-Osten
- Identifikation von kritischen Strömungsmustern für Jordanien
- Screening von Strömungsmustern in globlen Klimaszenarien
- Klimasensitivität von kritischen Strömungsmustern für Jordanien
regionale Klimaszenarien (Cordex-Mena)
- Aufbereitung von Tageswerten meteorologischer Eingangsgrößen für hydrologische Modellierung
- Auswertungen zur Klimasensitivität von Mittelwerten und Extremen
- Abgleich mit beobachteten Entwicklungen
Data
| dataset | provider | availability | temporal | spatial | Z500 | prec. | temp. | pres. | … |
|---|---|---|---|---|---|---|---|---|---|
| Reanalysis | ERA5 | 1979-2021 | daily | 0.5° | x | x | x | x | |
| Reanalysis | NCEP/NCAR | 1979-date | daily | 2.5° | x | ||||
| Eumetsat | HSAF | 2010-date | 15min | 1km | x | ||||
| Synoptical | JMD | 1979-date | hourly | station | x | x | x | ||
| Climate | JMD | 1979-date | daily | station | x | x | x | x | |
| Radar | JMD | 2018-date | subhourly | 25m | x | ||||
| Forecasts | GFS/ICON | 2010-date | hourly | 0.5° | x | x | x | x | |
| Scenarios | CMIP5/CMIP6 | 1979-2100 | daily | 1.0° | x | x | x | ||
| Scenarios | Cordex-Mena | 1979-2100 | daily | 0.22° | x | x | x | ||
| Composite | ERA5 | 1979-2020 | daily | 0.5 | x | x | x |
Diagnostics
Criticality of Circulation Patterns for Jordan

Services
Layout/Design
| Early Warning | Climate Service |
|---|---|
 |
 |
Spaghetti-Plots
- multi-model pattern intercomparison
| spatial | temporal |
|---|---|
 |
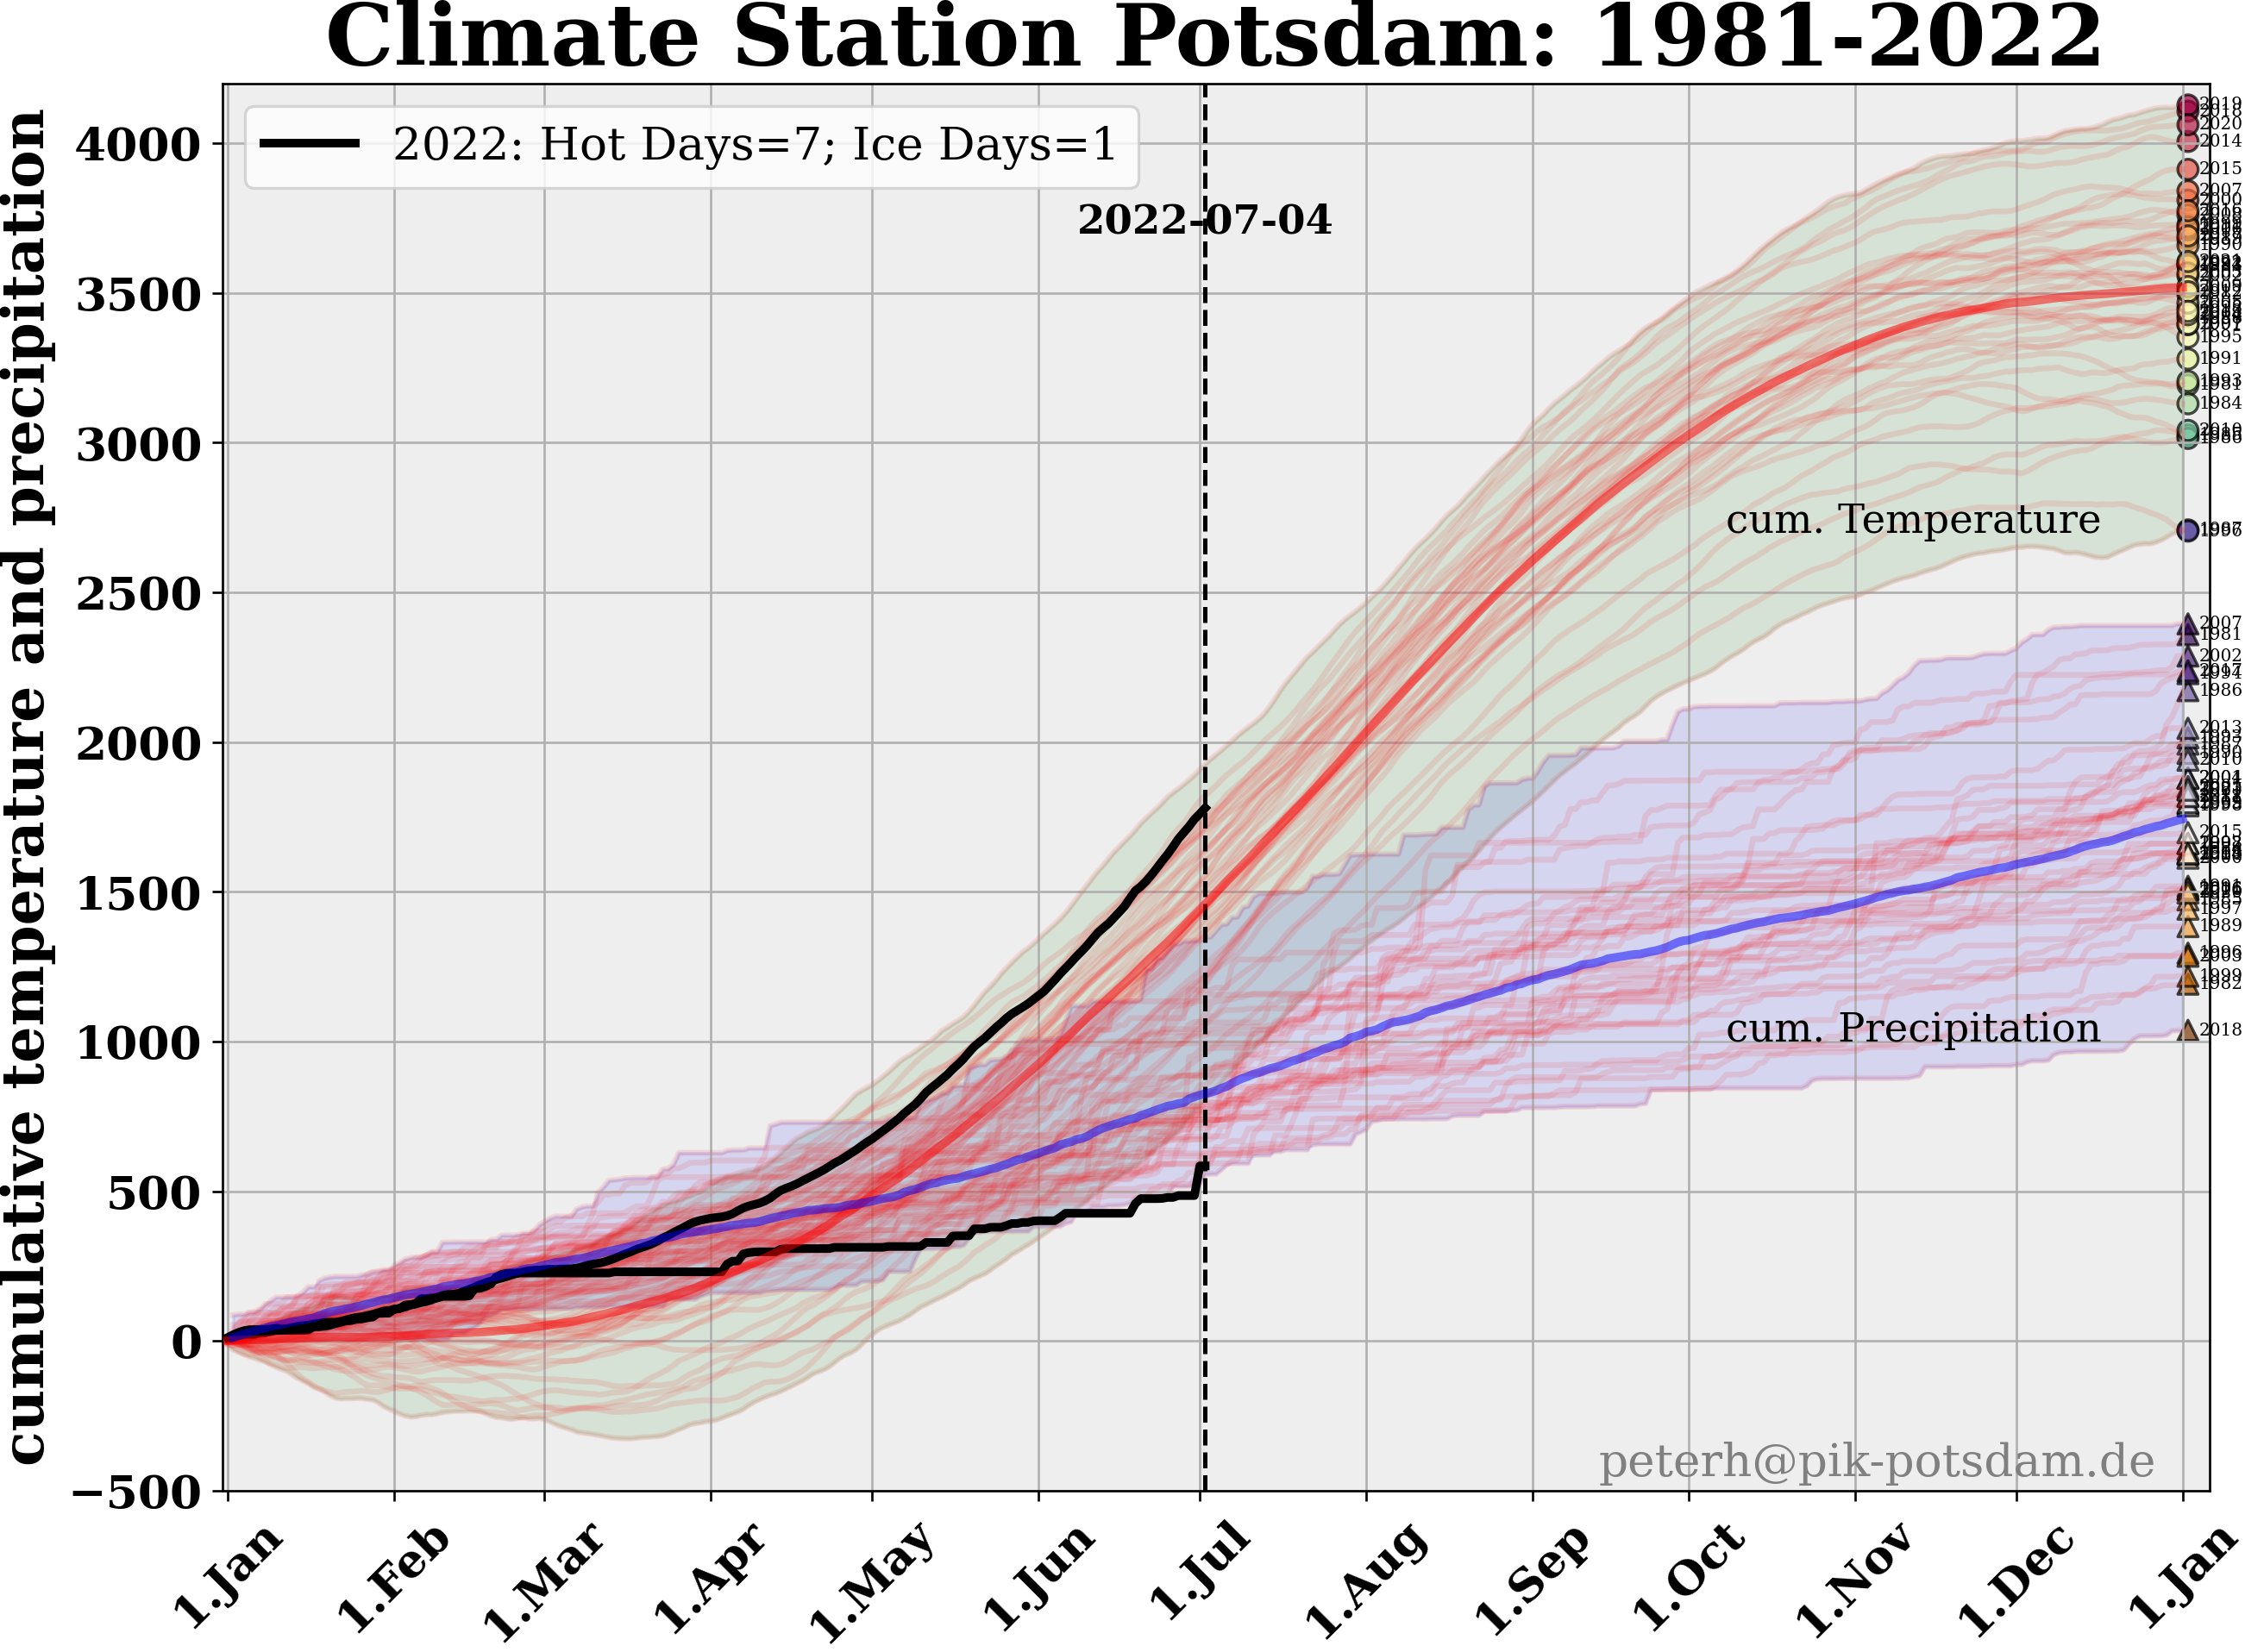
Cumulative Charts
- operational weather and climate monitoring for Amman

Risks Maps
- infografic of current risks for Jordan
